...
Decode Global Trade. Unlock Strategic Insight.
Last updated: Feb 10, 2026


Latest Data


The Observatory of Economic Complexity (OEC) offers detailed global trade data, covering over 5000 subnational regions, 5,000 products, and thousands of firms and fund managers. It enables users to explore trade patterns, compare economic performance, and generate reports quickly using clear visualizations. The OEC is designed to help analysts save time by providing fast access to relevant data and streamlined tools for analysis.
Explore Millions of
Interactive Profiles
Predict and Compare
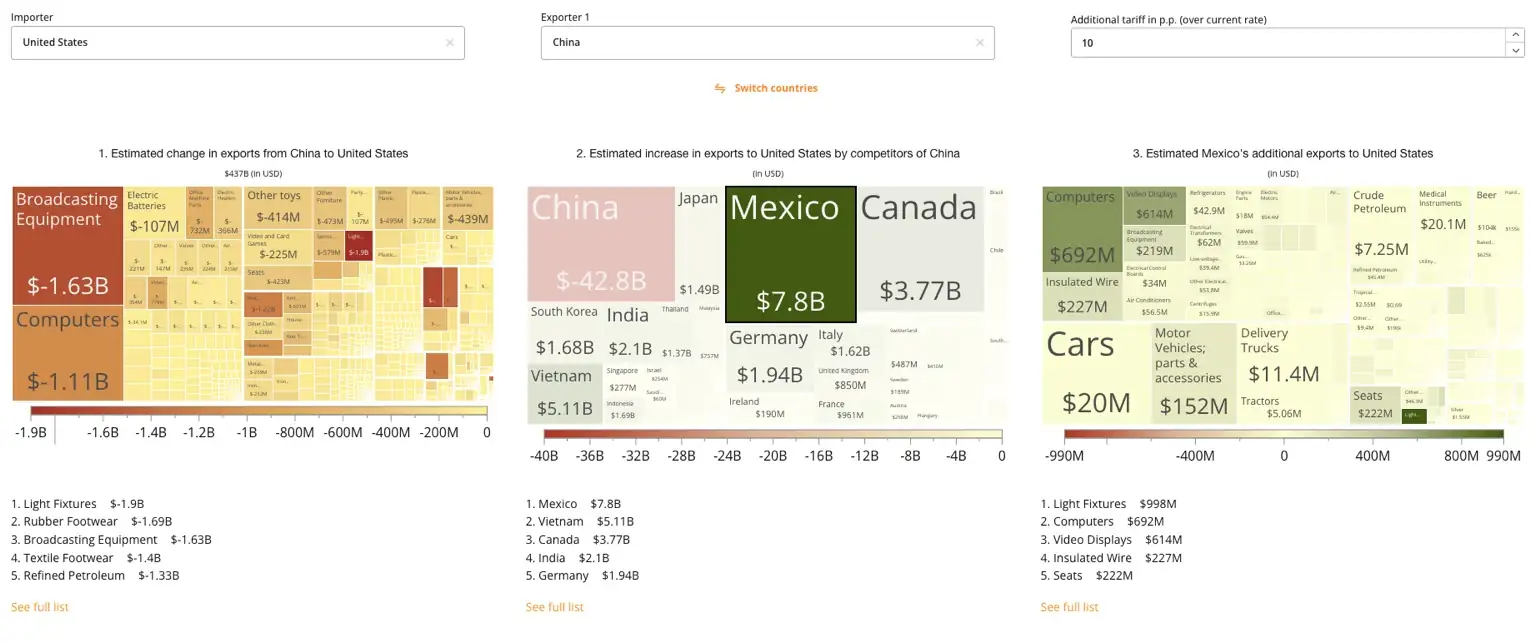
Curious to know how tariffs policies will shape trade? Use our Tariff Simulator to create scenarios and see the impact on global flows instantly.
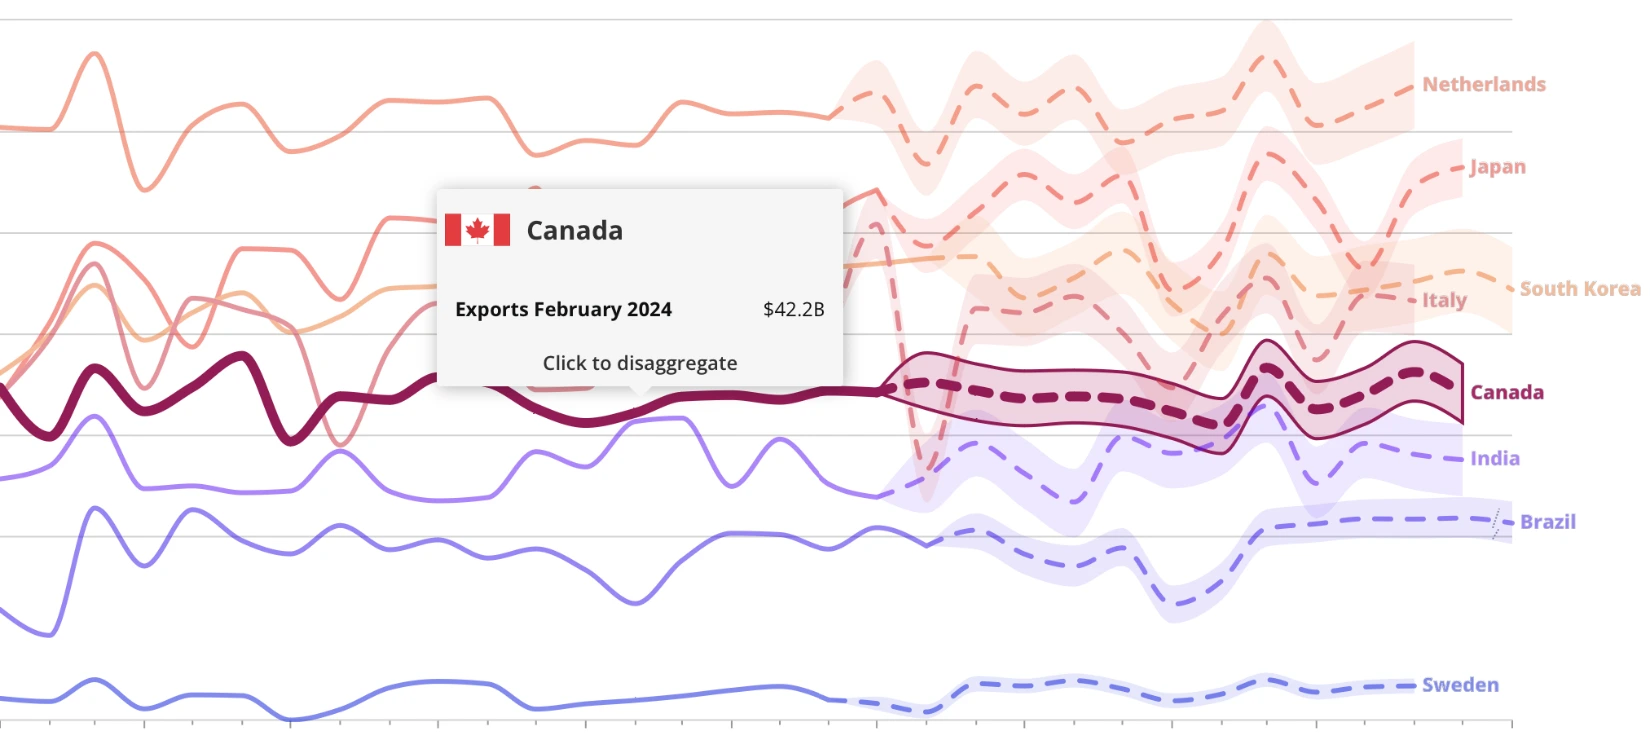
Build detailed monthly trade forecast with our time series prediction tool, disaggregate by regions, products, and markets.
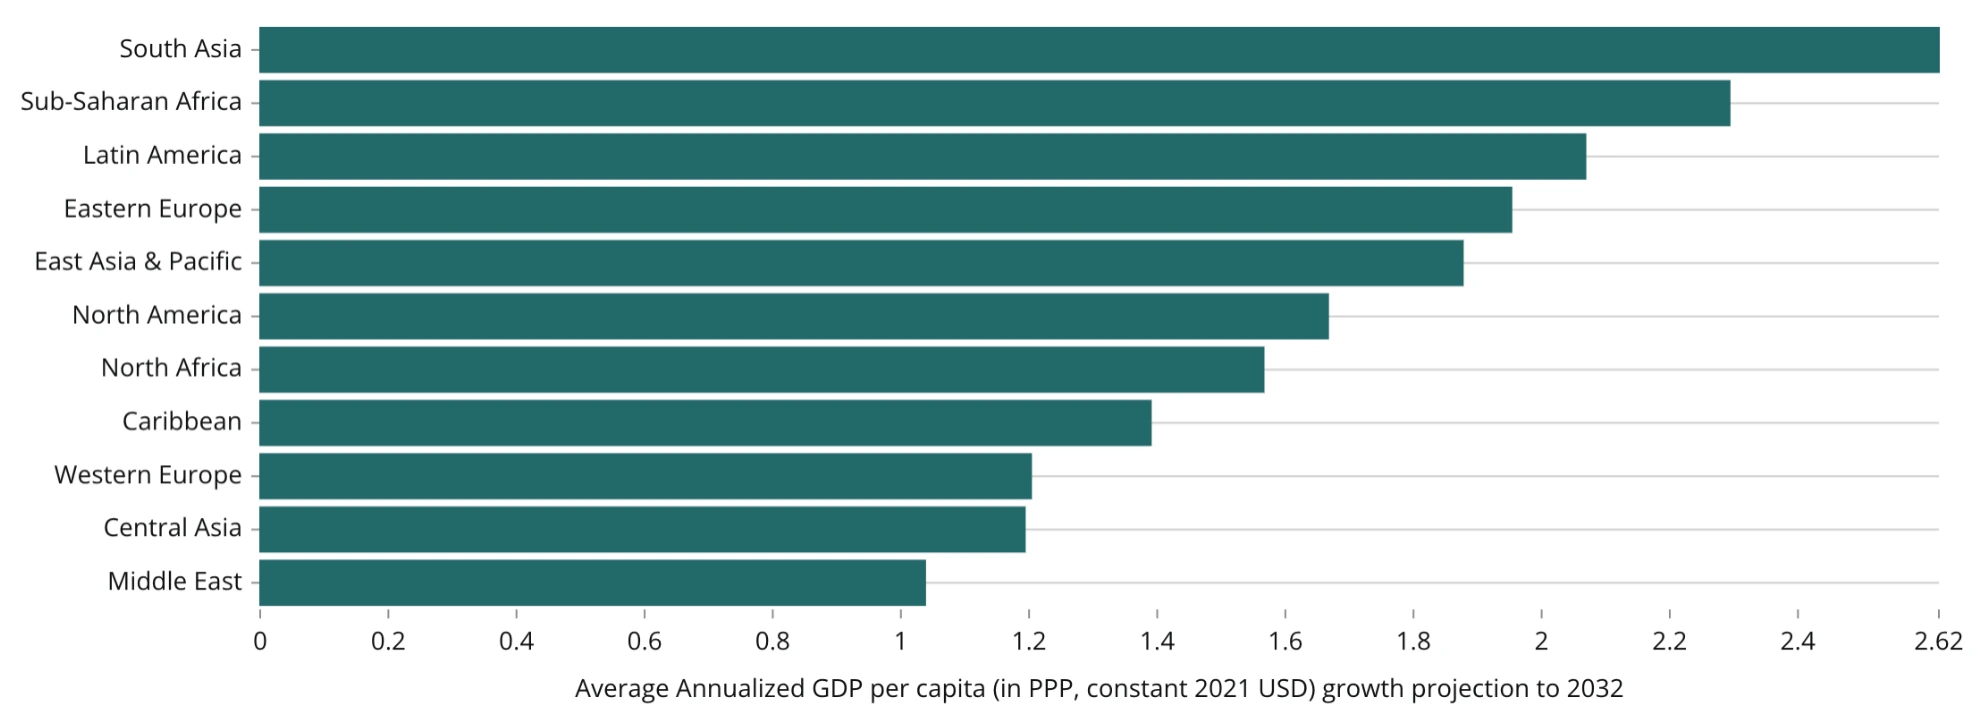
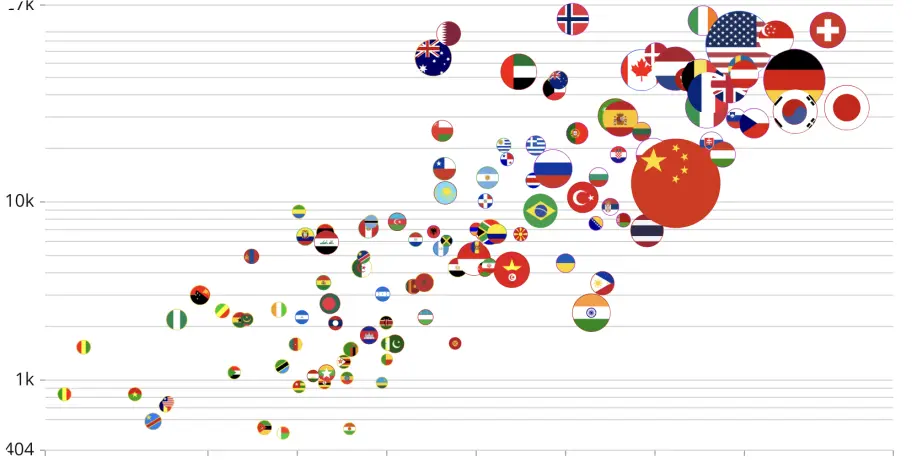
Compare the sustainable growth potential of hundreds of countries and thousands of products using economic complexity methods.
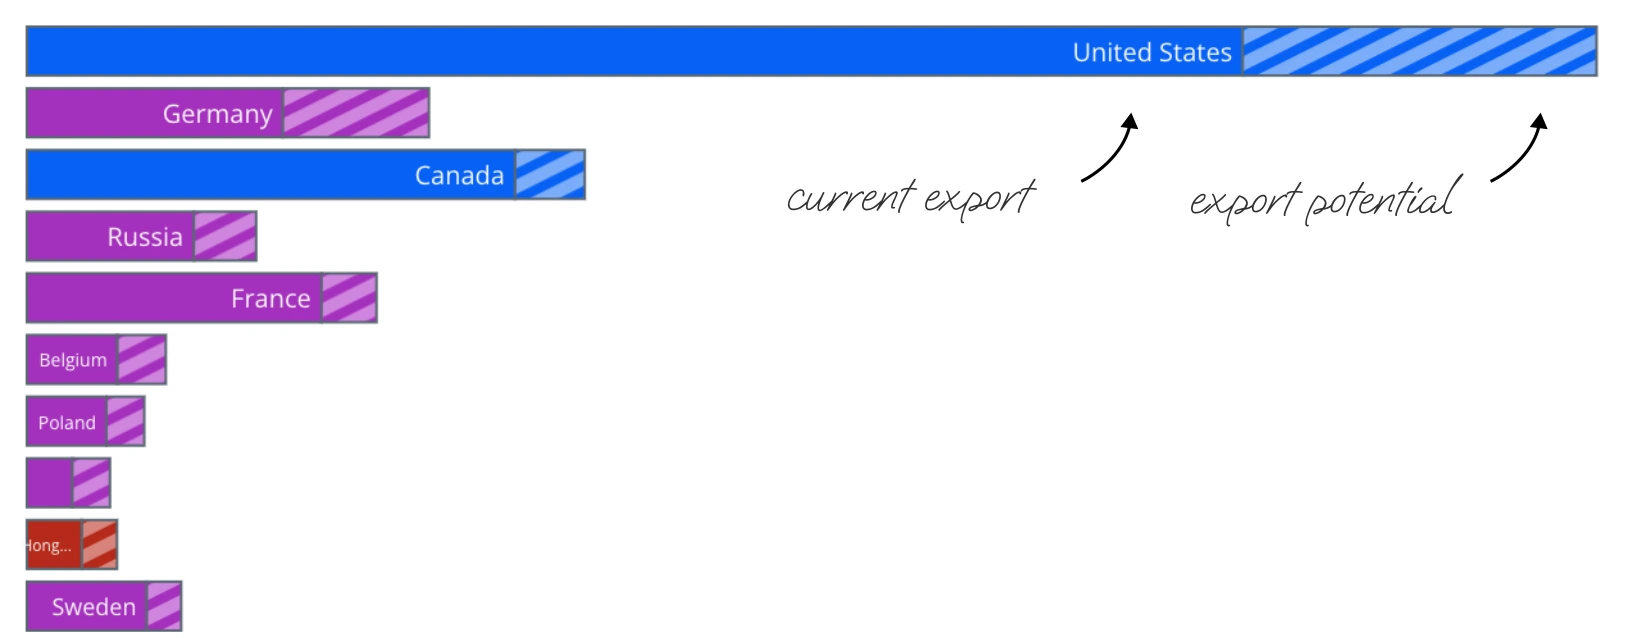
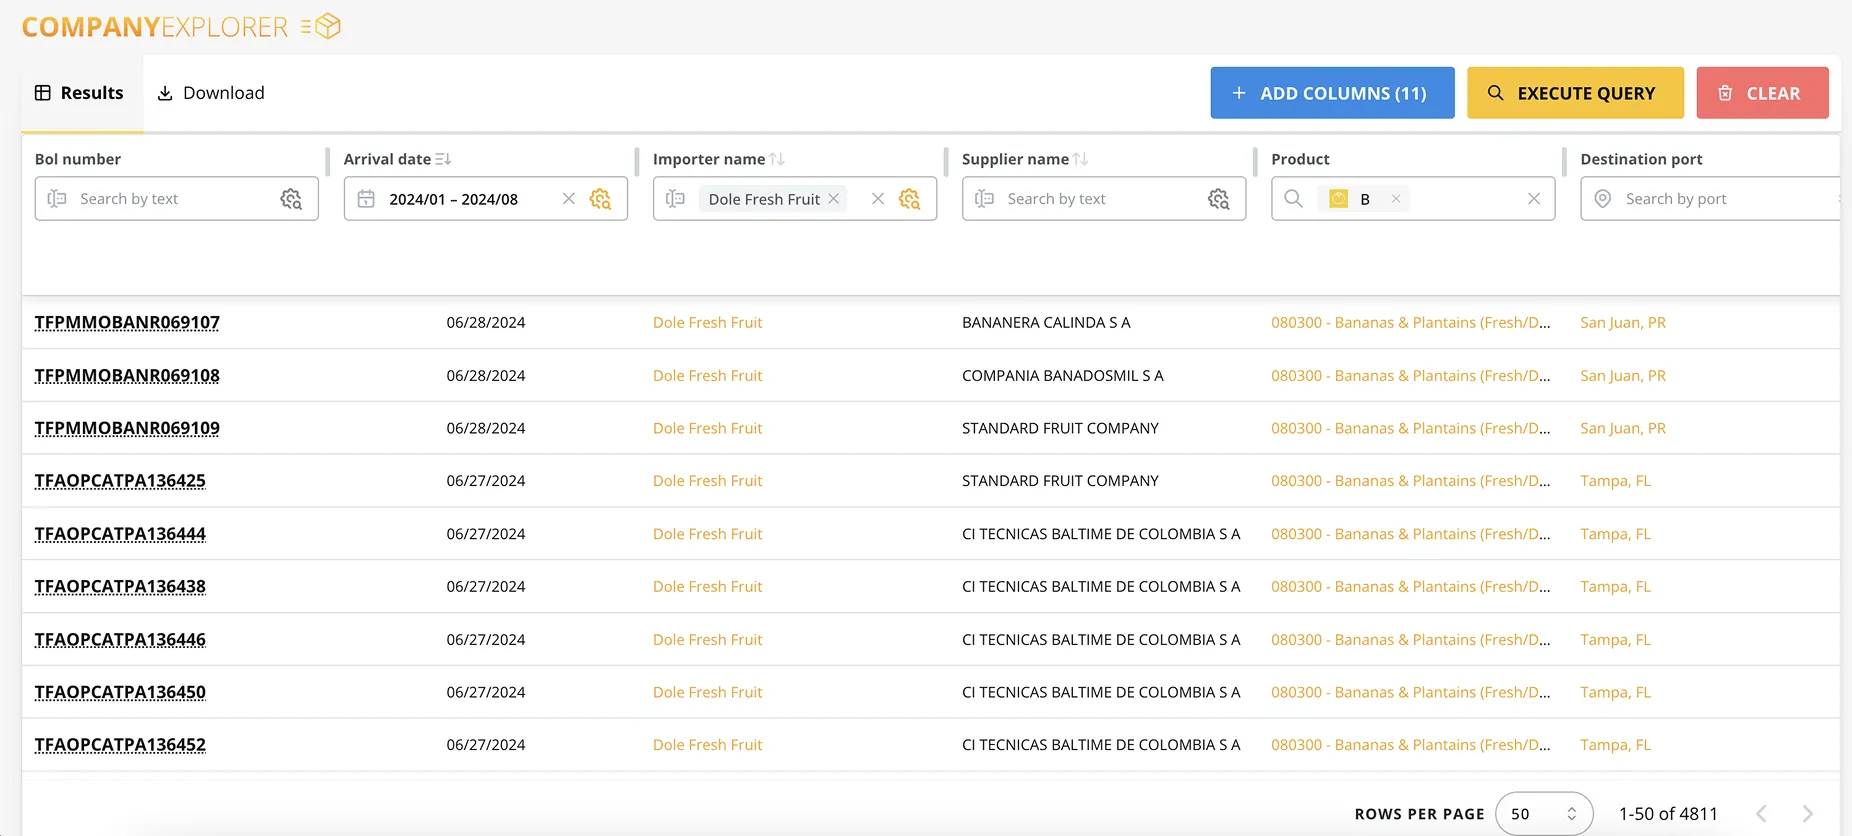
Are you an exporter looking to expand into new markets? Are you an importer looking for new suppliers? Are you an analyst in need of market intelligence forecasts?
Use our machine learning models to discover hidden trade opportunities.
Understand trade and Development by
Building Custom Visualizations
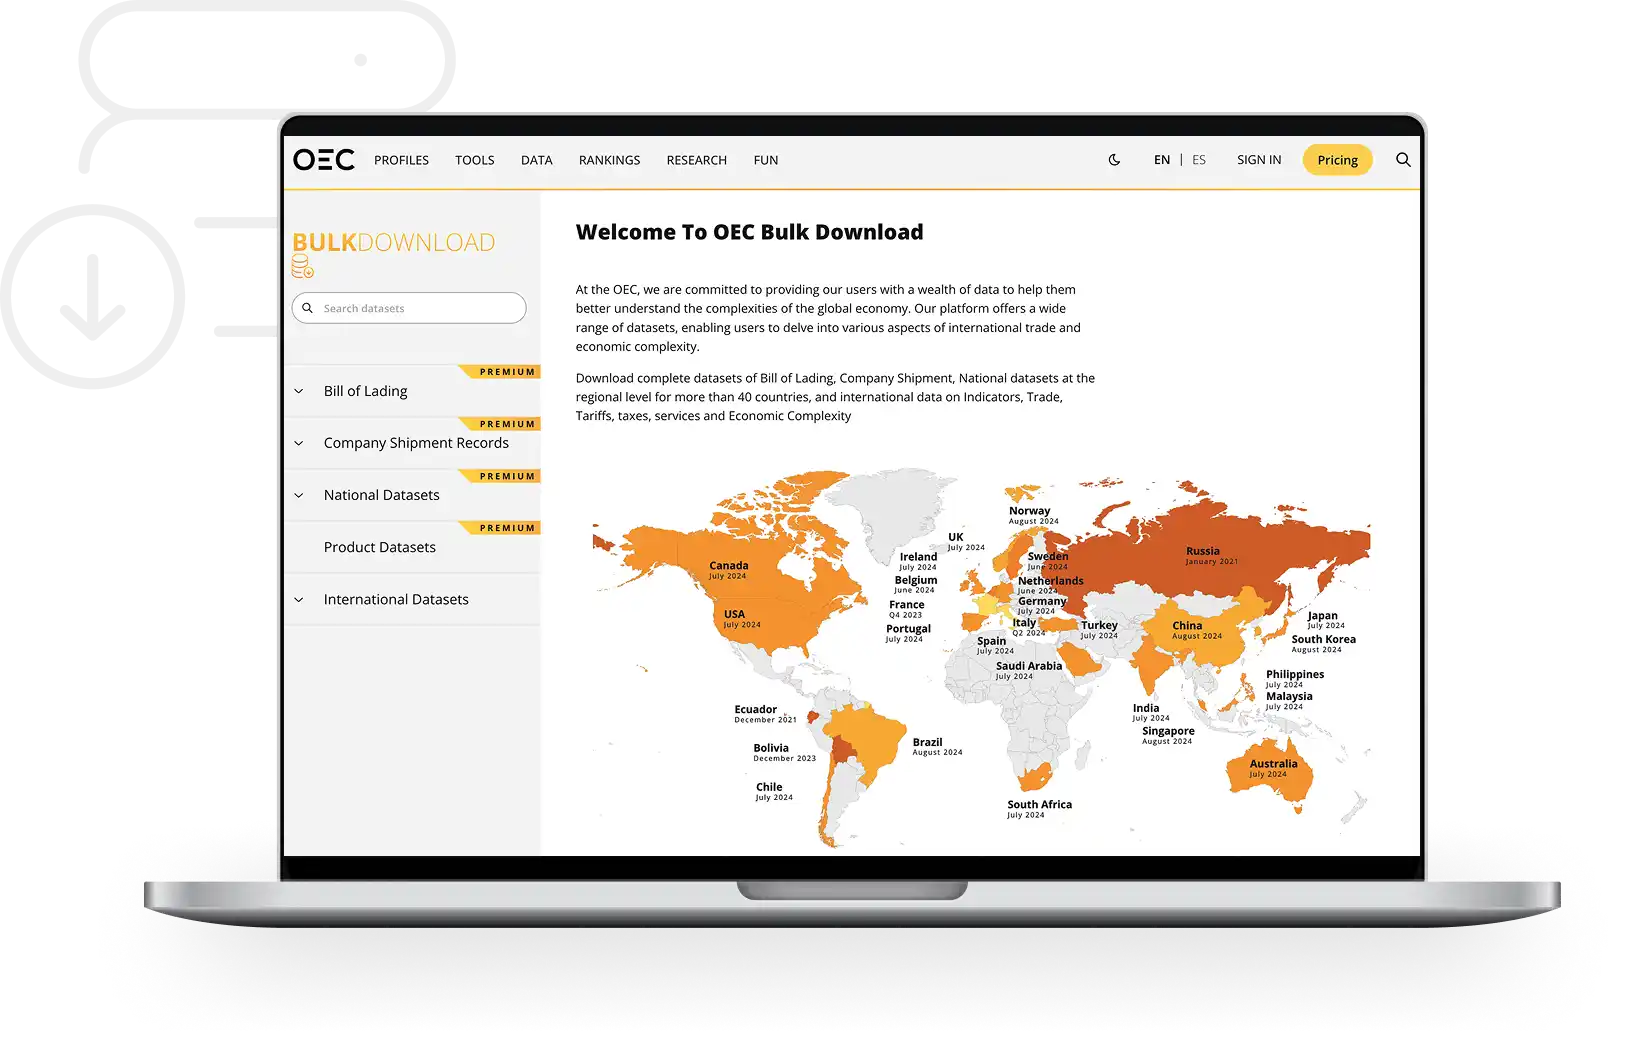
Download data
In Bulk or through the OEC API
Create
Custom Tables
Newcomer? Start here
Visit tutorials to learn how to use the OEC
Learn about
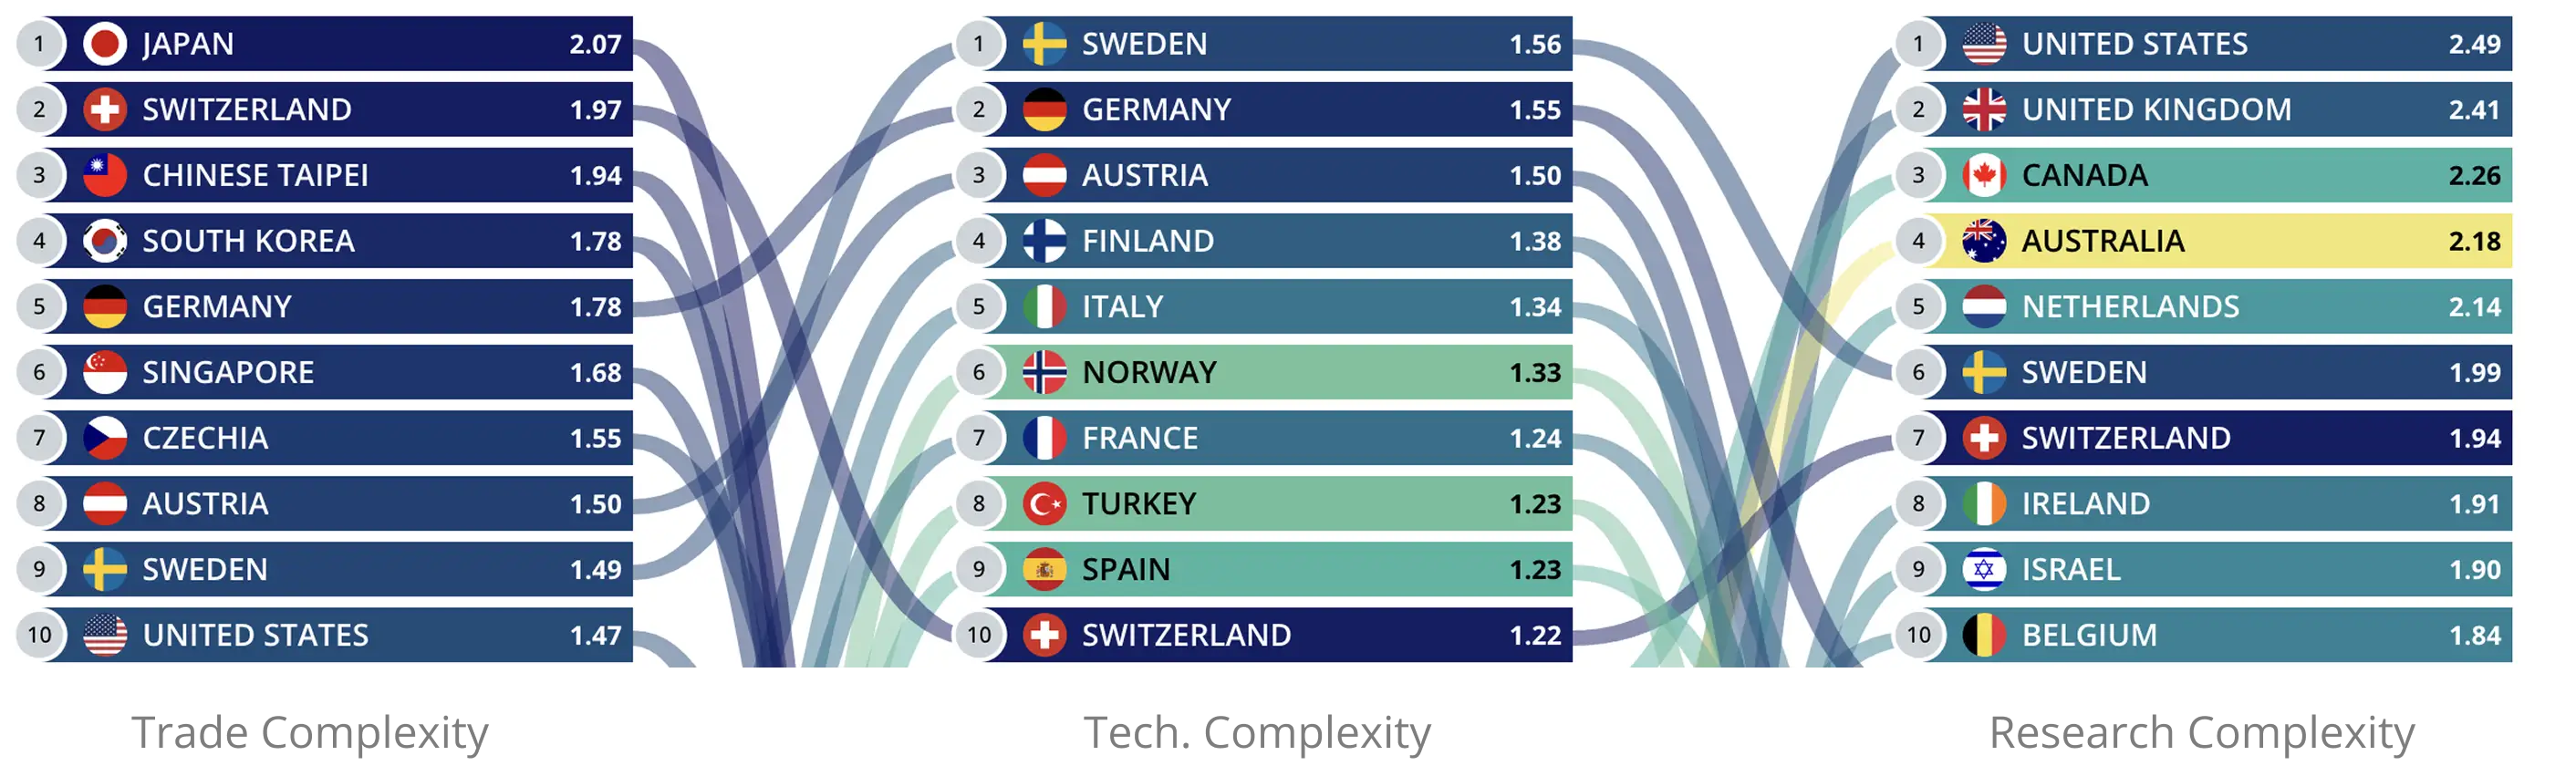
Economic Complexity
Compare the performance of countries in trade, tech, and research based measures of Economic Complexity.
Publications
Dozens of peer reviewed publications and books exploring the connection between economic complexity and development.
Read
Methods
Familiarize yourself with the basic techniques and concepts used in economic complexity.
Learn
Python Notebook
Use Python notebooks to access trade data through our API and perform basic economic complexity calculations.
Code
Play with our popular
Games