Economic Complexity Economic Growth Forecast (2032)
A key application of economic complexity is predicting long term economic growth.¹ This application builds on the fact that national incomes tend to converge among countries with a similar level or complexity.²–¹⁰ Here, you can find economic growth forecasts for 87 countries estimated using a multidimensional economic complexity framework.¹¹ This is a framework using data on the composition of a country’s exports, patents, and research publications that provides a more comprehensive view of an economy’s growth potential.
Annualized expected CAGR between 2022 and 2032
Rank | Country | Predicted Annual GDP per capita growth | ECI Trade | ECI Research | ECI Tech | GDP per capita (in PPP, constant 2021 USD) | Predicted ECI Trade growth |
|---|---|---|---|---|---|---|---|
No records to display | |||||||
0-0 of 0
Regional growth projections
Based on our projections, South Asia will lead global growth during the next decade with an expected growth rate of 2.62%. The region will be led by the growth of India (4.20%), which is expected to be a top global performer. We also expect high growth potentials in East Asia & Pacific, with countries like the Philippines (3.79%), Vietnam (3.04%), and China (2.93%) contributing to the region’s average growth rate of 1.88%. Central Asia is expected to show more modest growth led by the growth of Uzbekistan (2.42%).
Figure 1. Average Multidimensional ECI growth projections by region for 2032.
Figure 2. Multidimensional ECI growth projections by country for 2032.
Latin America’s economic growth is expected to average 2.07%—led by Brazil (2.97%), Mexico (2.65%), and Colombia (2.69%). In Central America, Panama (1.70%) and Costa Rica (1.60%) are expected to be top performers, reflecting their efforts to diversify beyond traditional trade.
In Africa, Saharan and Sub-Saharan Africa present a contrasting picture. North African growth will be led by Morocco (2.82%), who has in some ways transitioned into a manufacturing economy. Sub-Saharan Africa shows an even stronger growth potential, with a 2.29% for the region, led by Uganda (3.18%) and South Africa (3.14%) as top performers.
In Europe, Eastern Europe is expected to outpace Western Europe when it comes to economic growth, with an average growth rate of 1.95% compared to 1.20% for Western Europe. Countries like Bosnia and Herzegovina (2.59%) and Serbia (2.28%) appear to have levels of economic complexity that support higher incomes. In Western Europe, Portugal (1.74%) and Spain (1.70%) show the highest growth potential.
FAQ
What are the benefits of using a multidimensional economic complexity framework for forecasting?
While trade-based measures of economic complexity are valuable, they come with limitations. For example, high levels of economic complexity (ECI (trade)) sometimes reflect a country’s integration into global value chains, like in the case of Slovakia or Mexico, which are integrated, respectively, with the manufacturing sectors of Germany and the United States.¹² Similarly, countries that are geographically distant from global markets can exhibit low trade complexity because it is more convenient for them to specialize in the exports of natural resources (e.g. Australia, Chile). Fine grained data on patents, research papers, and software, can overcome some of these limitations, since these are forms of economic output that are less constrained by geographic distance. By integrating multiple data sources in a multidimensional approach, we can obtain a more accurate estimate of an economy’s growth potential.
What approach are you using to forecast growth?
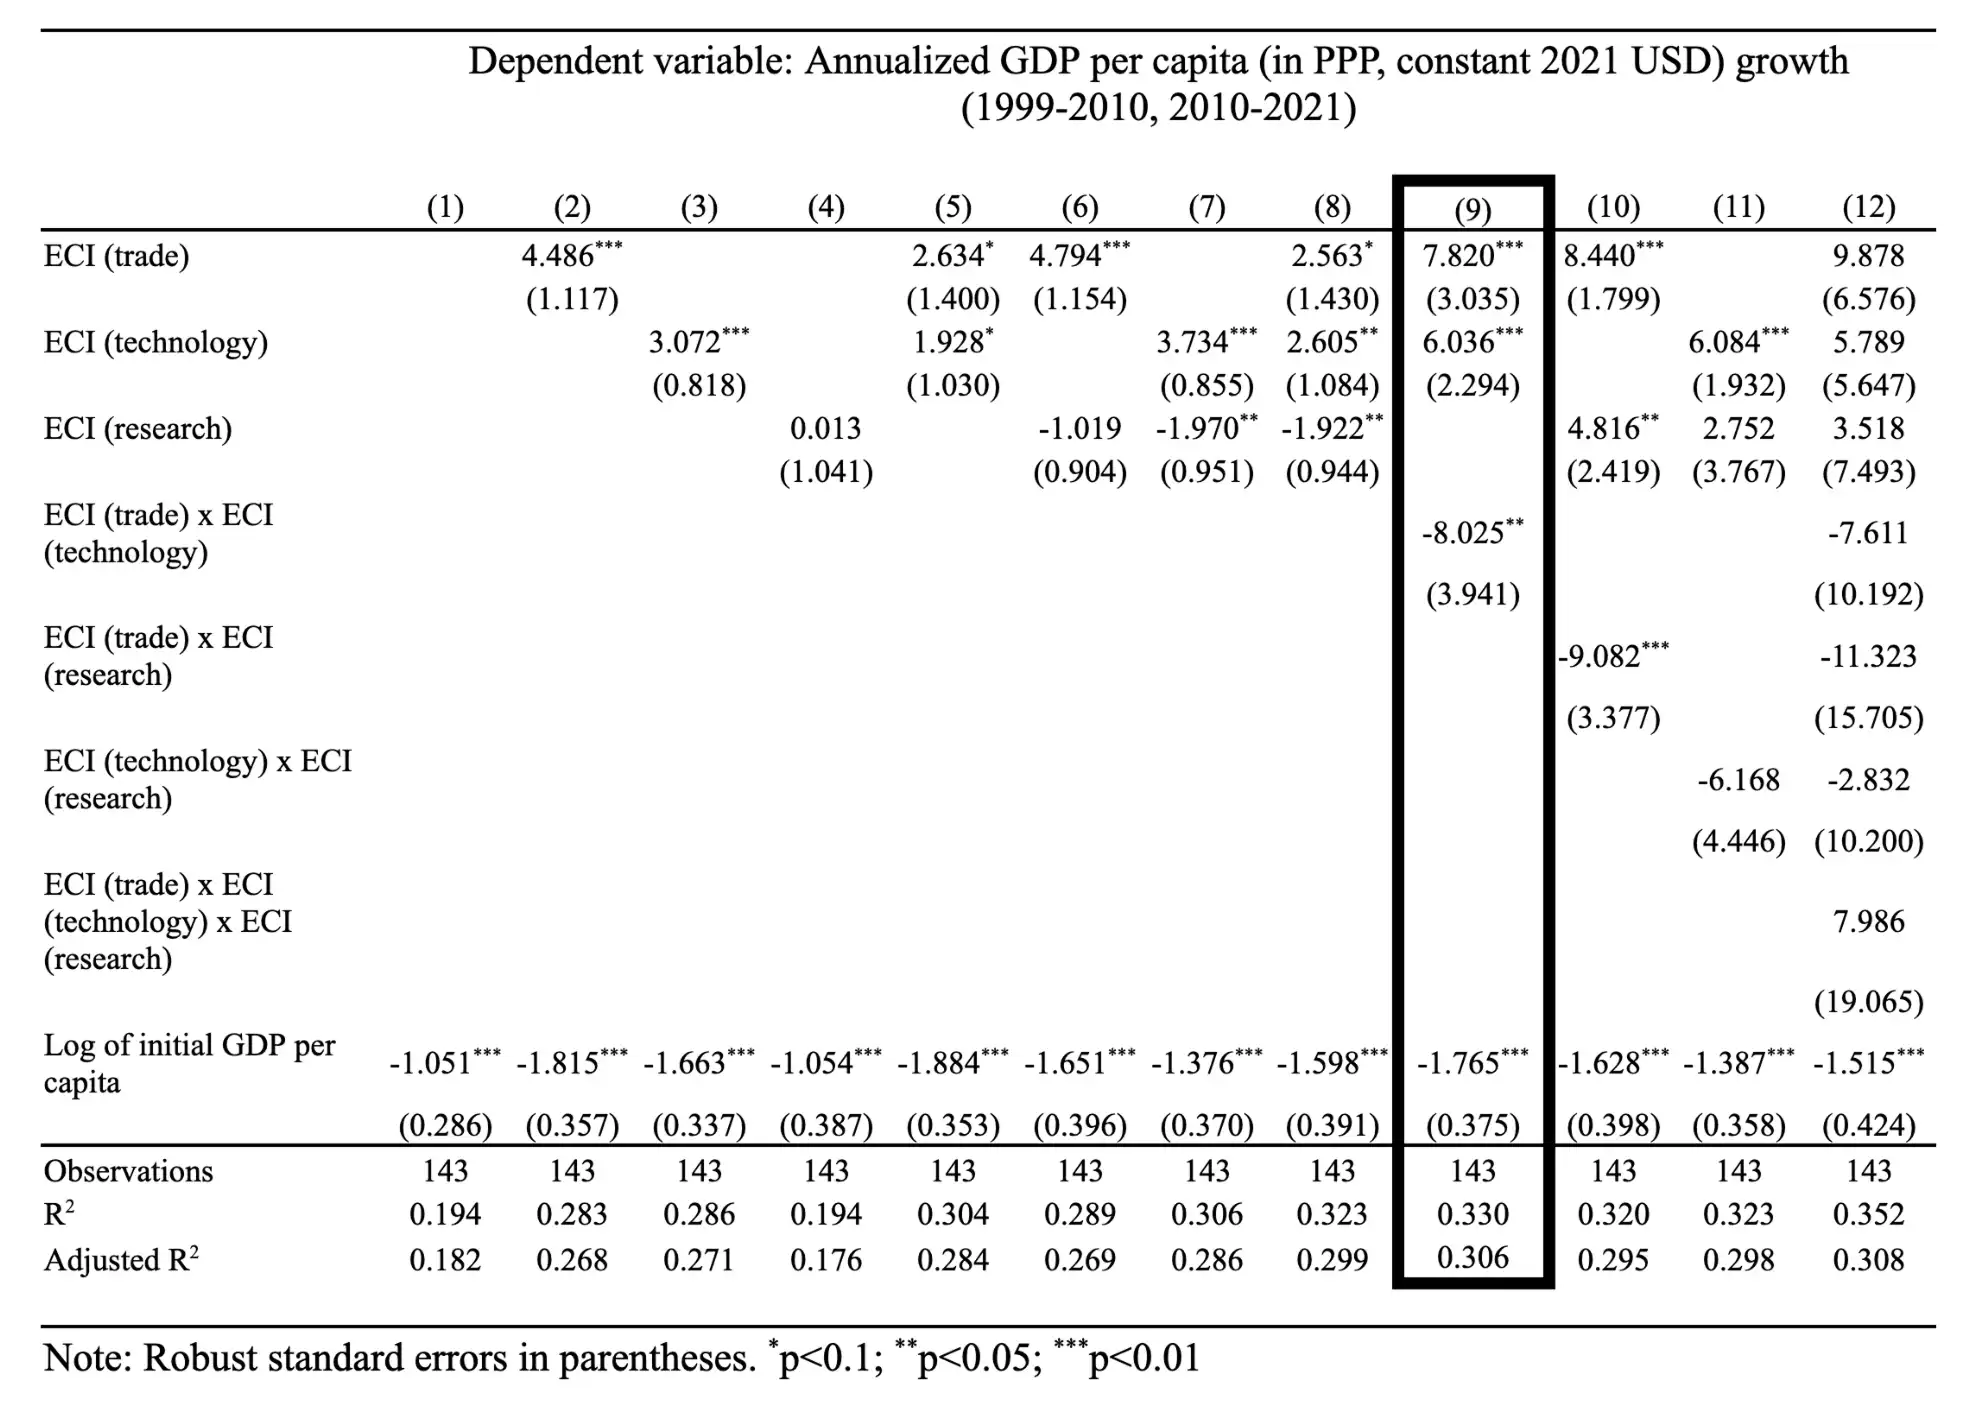
We are following Stojkoski et al. (2023)¹¹ method, which consists of calculating three separate metrics of Economic Complexity: ECI (trade) using export data, ECI (technology) using patent application data, and ECI (research) using research publication data, and using them as explanatory variables in regressions that explains annualized GDP per capita growth (in 2021 PPP USD). We include initial GDP per capita to account for economic convergence and period fixed effects to capture global factors influencing growth during these decades. After a model selection step, we find that the model including only ECI (trade) and ECI (technology) is the best at explaining long-term economic growth (working partly as substitutes, since they exhibit a negative interaction term between them). We call this model the final multidimensional model. We calibrate this model using data from across two 11-year periods (1999-2010 and 2010-2021) and then use 2021 data to create the baseline from which we predict annual growth rates up to 2032 (assuming that the global conditions would remain similar to the fixed effects estimated for 2010).
How much better are multidimensional ECI forecasts compared to ECI(trade) forecasts?
In Table 2, we show the results of the multidimensional economic complexity regression models. We find that the best multidimensional economic complexity model (including ECI (trade), ECI (technology), and their interaction) is almost 4 percentage points better at explaining international variations in economic growth than models based on trade complexity alone. Namely the adjusted R-squared, a measure of model performance, for the final multidimensional ECI model is 0.306 (column 9 of Table 2), whereas for the ECI (trade) model is 0.268 (column 2 of Table 2).
Table 2. Multidimensional Economic Complexity Economic Growth Regression Results.
But the differences between the multidimensional model and the ECI (trade) model go beyond predictive performance.
Consider China. When comparing multidimensional ECI predictions with those based solely on trade data, China stands out as a case of remarkable consistency. Its growth predictions remain nearly unchanged between the two models, with 2.91% in trade and 2.93% in the multidimensional model. This stability reflects China’s balanced integration of trade and technology within its economic strategy. But China is an exception rather than the norm when comparing the multidimensional and trade-only approaches.
Figure 3. Differences between Multidimensional ECI predictions and ECI (trade) predictions.
Consider Uganda and India. On the one hand, Uganda emerges as the top performer in the trade-based model with a predicted growth rate of 3.99%, but this figure drops to 3.18% in the multidimensional model. This decline highlights Uganda’s relatively low technological complexity, suggesting that its strong trade activities alone might not be sufficient to sustain higher long-term growth. On the other hand, India demonstrates the opposite trend. While its trade-based prediction is already strong at 3.65%, it climbs to 4.20% in the multidimensional model, making it the global leader. This increase underscores the critical role of India’s technological advancements in boosting its overall economic potential.
Consider also Australia and Germany, which further illustrate how the multidimensional approach can significantly alter growth predictions. Australia experiences a substantial increase in its predicted growth rate, rising from -0.54% in the trade model to a positive 1.02% in the multidimensional model, driven by its strong emphasis on technological innovation. Conversely, Germany’s growth potential decreases from 1.82% in the trade model to 1.19% in the multidimensional model, suggesting that while Germany excels in trade, its portfolio of patents may not be as advanced as its trade performance might indicate. These examples highlight the importance of incorporating multiple dimensions of economic activity to gain a more accurate and nuanced understanding of future growth potential.
But even the multidimensional approach is not without limitations. Namely, while our method excels in highlighting structural growth potential, it is important to recognize that it does not account for short-term disruptions such as inflation, pandemics, or conflicts. These factors, although impactful in the short term, are typically transitory and tend to balance out over time. Because our analysis does not incorporate these disruptions, the estimates might differ from current realities in situations where significant events occur (e.g., wars). As a result, while our approach offers robust insights into long-term growth potential, it is crucial to consider that external factors could lead to deviations from these projections.
In conclusion, the multidimensional approach to economic complexity equips policymakers with a powerful tool for projecting future growth. By integrating key aspects of an economy’s complexity, we can better identify the drivers of economic development through 2032, ensuring that strategies are aligned with the long-term resilience and growth potential of nations in an increasingly complex global economy.
How is the ECI model performing compared to models based on other metrics of sophistication?
We compared the performance of a baseline ECI (trade) model with a model that uses another measure of export sophistication, known as EXPY. The EXPY metric is essentially the average income per capita of countries exporting a similar set of goods.
Our findings reveal that the ECI model is significantly better at explaining economic growth (as shown in column 2 of Table 3), whereas the log of EXPY does not demonstrate the same explanatory power (as seen in column 3 of Table 3). When both measures are included in a combined model, ECI clearly outperforms the log of EXPY (column 4 of Table 3).
This difference arises because EXPY is more closely correlated with initial GDP per capita—since it is constructed using GDP per capita data—which leads to high multicollinearity between EXPY and GDP per capita in the model. Economic complexity is therefore better at capturing information about the composition of an economy that is not yet expressed in its level of income (Figure 4).
Table 3. Baseline comparison of ECI and EXPY in explaining economic growth.
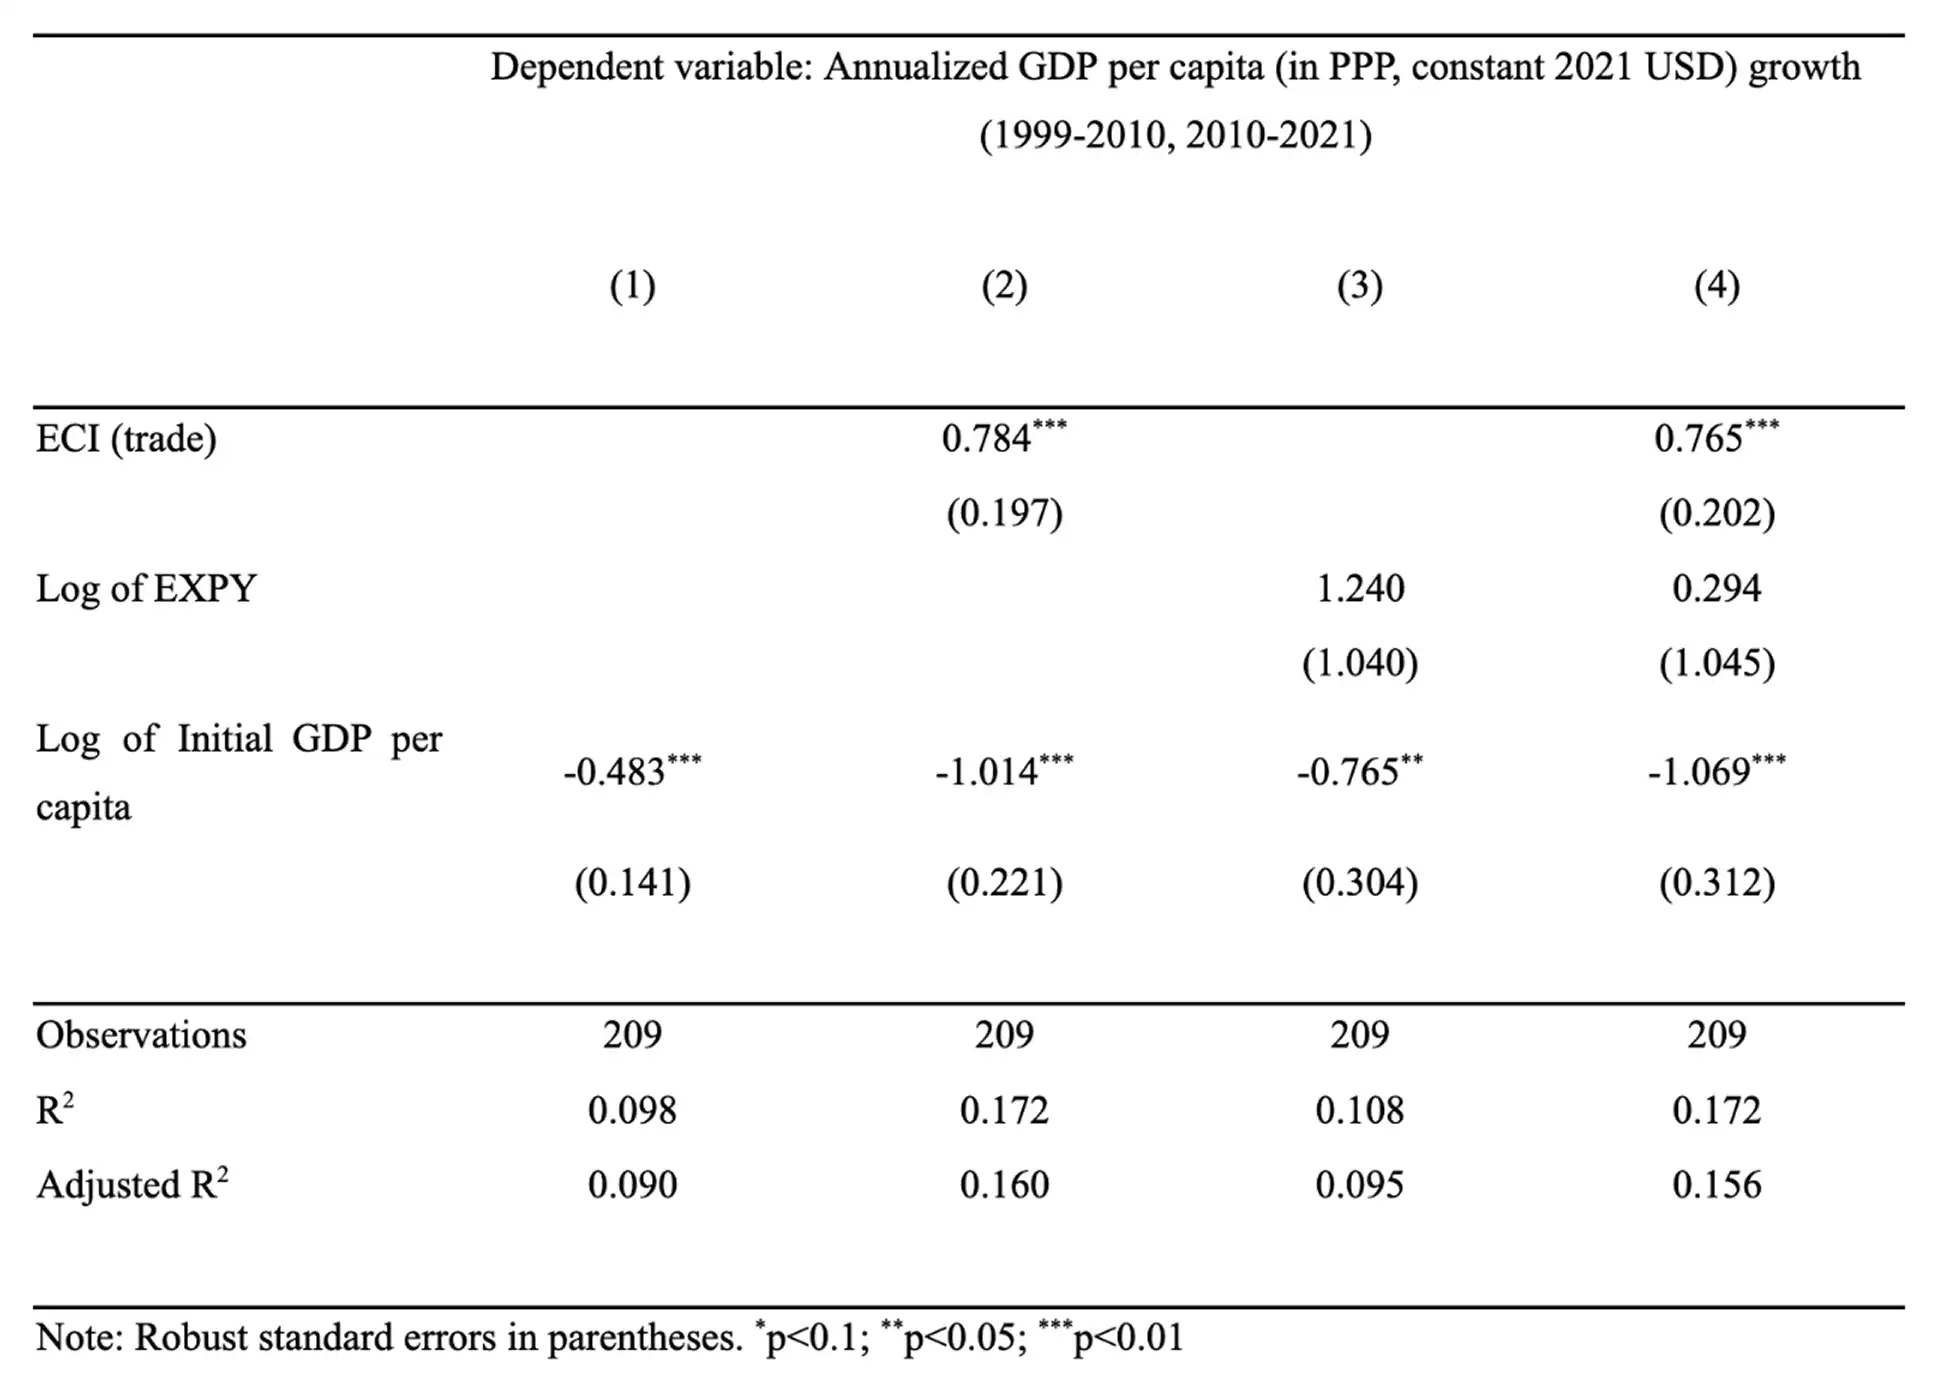
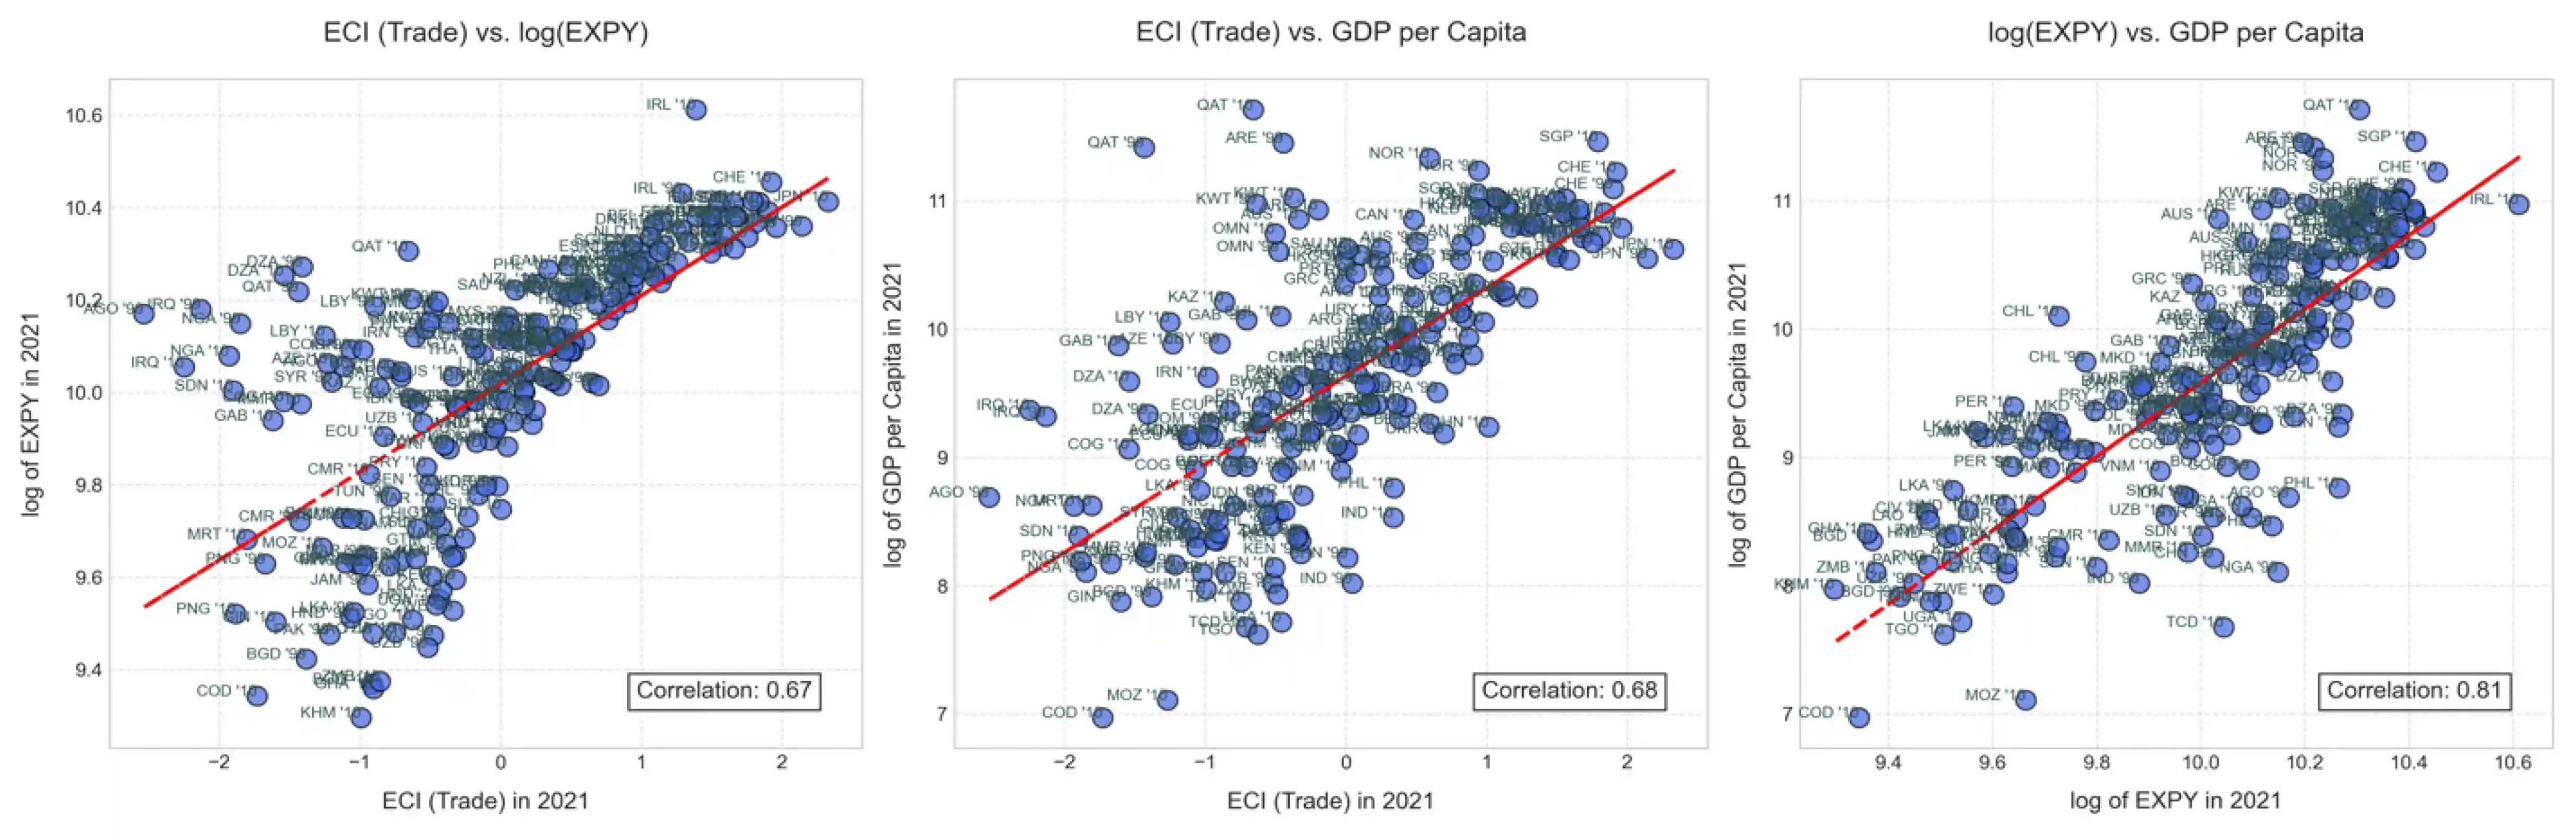
Figure 4. Scatter charts showing the correlation between ECI (trade), log of EXPY, and GDP per capita in our data.
Are these results robust to potential endogeneity issues?
In Stojkoski et al.¹¹, we try to address endogeneity concerns by substituting the complexity of each country with the average complexity of their three most similar non-neighboring countries. For example, Japan shares a similar export structure with the UK, Germany, and Czechia. This approach provides us with a measure that is not influenced by uniquely Japanese factors (such as language, culture, or history), but is still closely related to Japan’s productive structure. While this is not a perfect identification strategy, it helps test the robustness of these findings. The multidimensional economic complexity growth models remain consistent when using the complexities of similar non-neighbors, indicating that the outcomes are likely driven by aspects related to the composition of exports, technology, and research. More about this approach can be found in Stojkoski et al.¹¹, where we discuss these methods and their implications in greater detail.
References
- Hidalgo, C. A. & Hausmann, R. The building blocks of economic complexity. Proceedings of the national academy of sciences 106, 10570–10575 (2009).
- Hausmann, R., Hidalgo, C. A., Bustos, S., Coscia, M. & Simoes, A. The Atlas of Economic Complexity: Mapping Paths to Prosperity. (Mit Press, 2014).
- Chávez, J. C., Mosqueda, M. T. & Gómez-Zaldívar, M. Economic complexity and regional growth performance: Evidence from the Mexican Economy. Review of Regional Studies 47, 201–219 (2017).
- Domini, G. Patterns of specialization and economic complexity through the lens of universal exhibitions, 1855-1900. Explorations in Economic History 83, 101421 (2022).
- Koch, P. Economic Complexity and Growth: Can value-added exports better explain the link? Economics Letters 198, 109682 (2021).
- Ourens, G. Can the Method of Reflections help predict future growth? Documento de Trabajo/FCS-DE; 17/12 (2012).
- Stojkoski, V. & Kocarev, L. The relationship between growth and economic complexity: evidence from Southeastern and Central Europe. (2017).
- Stojkoski, V., Utkovski, Z. & Kocarev, L. The impact of services on economic complexity: Service sophistication as route for economic growth. PloS one 11, e0161633 (2016).
- Tacchella, A., Cristelli, M., Caldarelli, G., Gabrielli, A. & Pietronero, L. A new metrics for countries’ fitness and products’ complexity. Scientific reports 2, 1–7 (2012).
- Cristelli, M., Gabrielli, A., Tacchella, A., Caldarelli, G. & Pietronero, L. Measuring the intangibles: A metrics for the economic complexity of countries and products. PloS one 8, e70726 (2013).
- Stojkoski, V., Koch, P. & Hidalgo, C. A. Multidimensional economic complexity and inclusive green growth. Communications Earth & Environment 4, 130 (2023).
- Salinas, G. & Muñoz, S. Proximity and Horizontal Policies: The Backbone of Export Diversification and Complexity. IMF Working Papers 2021, (2021).
- Hausmann, R., Hwang, J. & Rodrik, D. What you export matters. Journal of economic growth 12, 1–25 (2007).