
OEC Pro API Documentation
PRO
Introduction
Welcome to the OEC PRO API. In this document you will learn how to construct a variety of API endpoints to fetch the specific slice of data you need. You will also learn how to use the Data Explorer, a UI to facility constrcuting API queries and easily viewing data right in your browser.
To get started you will first need to subscribe as a Pro User, if you have not done so already. Once you have subscribed successfully and are logged in with your new pro account, you should see the following page, which will contain the token needed to authenticate all of your API requests to the server.
Please note:
You should treat your API token like a password and make sure not to share it with anyone or post it online where others could use it to make requests on your behalf. If at any point, you need to generate a new token, simply go to your user account page and click the button next to your token to generate a new one.

Make Your First Data Request
Fetching data is easy! The OEC API is designed for interoperability and can be integrated with many different programs. Below is an example showing how you can request the latest month's exports from US customs port-level data.
Generating API URLs Using The Data Explorer
Let's get started with a few examples to help us learn how to use the Data Explorer. You can access the Data explorer directly from your account page or by going to https://oec.world/en/explorer.
Example 1
Latest monthly product trade data for China
Once you have logged in you should see the following screen. On the left-hand side is where you will begin constructing your queries. So let's dive right in with our first example!
- •First we need to select the appropriate dataset, in our case this will be the China Regional Cube. Under the 'Dataset' heading select 'National' and then 'China' from the dropdown list.
- •Second, let's select bothTrade ValueandQuantityfrom the list of Measures.
- •Next, we should select from the Drilldown menu the following dimensions in order:
- •Product: At the level of hierarchy we are looking for. In this example, we will selectHS4(referring to Harmonized System Product Classification at the 4-digit level).
- •Time: At the Month level of hierarchy.
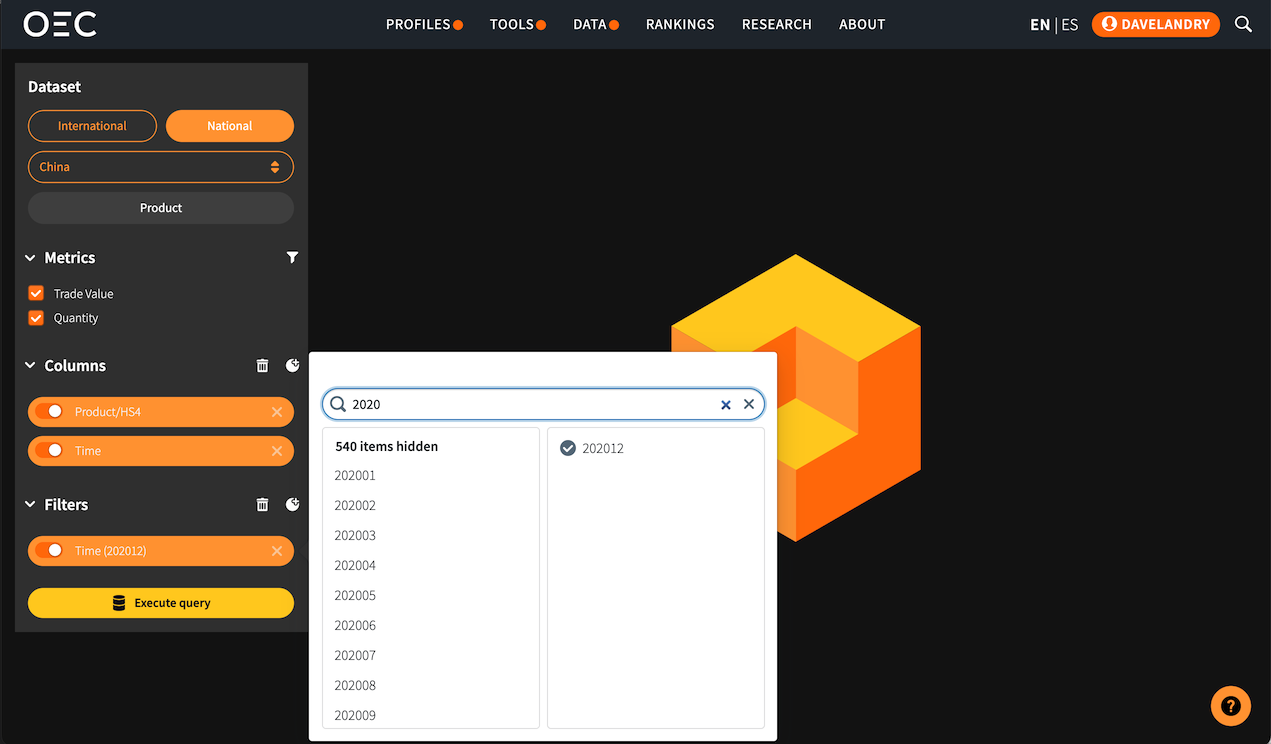
- •And finally, let's add aCut:
- •Time: timestamps are formatted as YYYYMM, so if we search for 202012 we'll get data for December of 2020.
Data Table
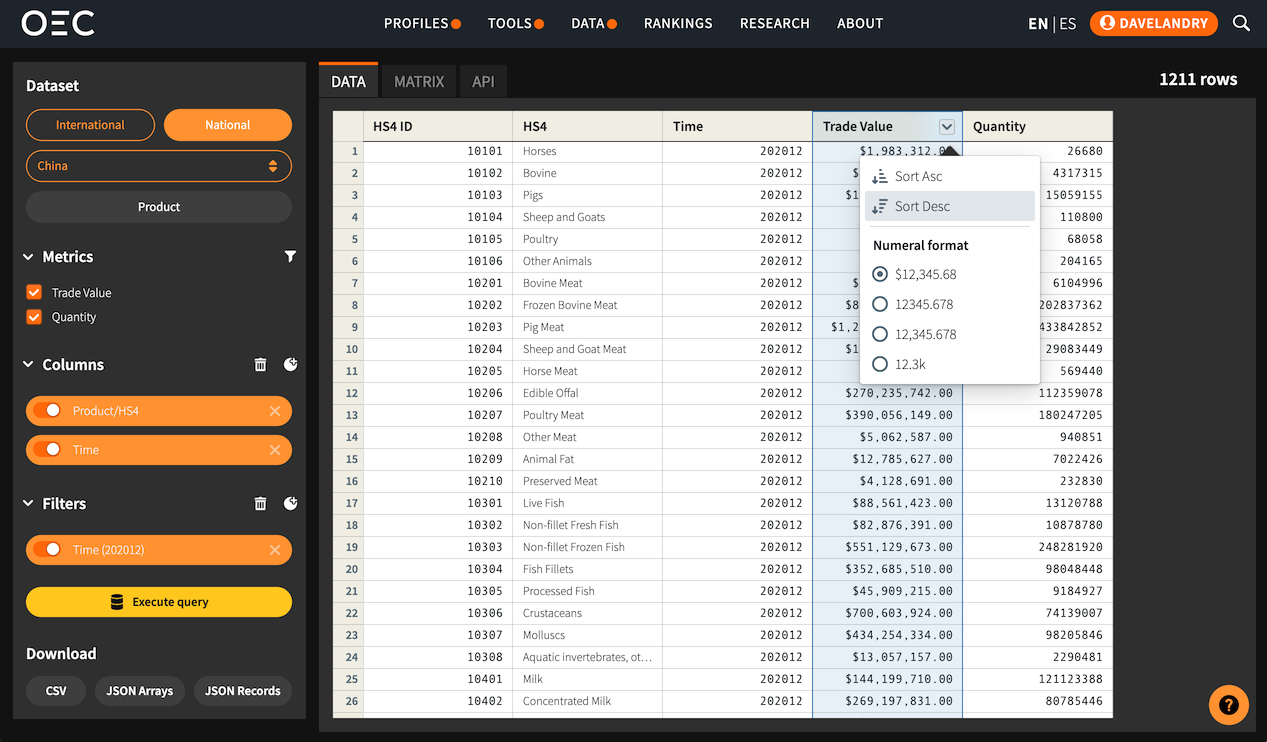
After clicking the 'Execute query' button you should see the following results. The results will contain any columns we selected as drilldowns or measures from our previous data selection step.
Now that our Data has been retrieved we can sort and format the results. Clicking the arrow button next to any measure column will bring out a pop-up menu allowing us to sort the results on this column or format them.
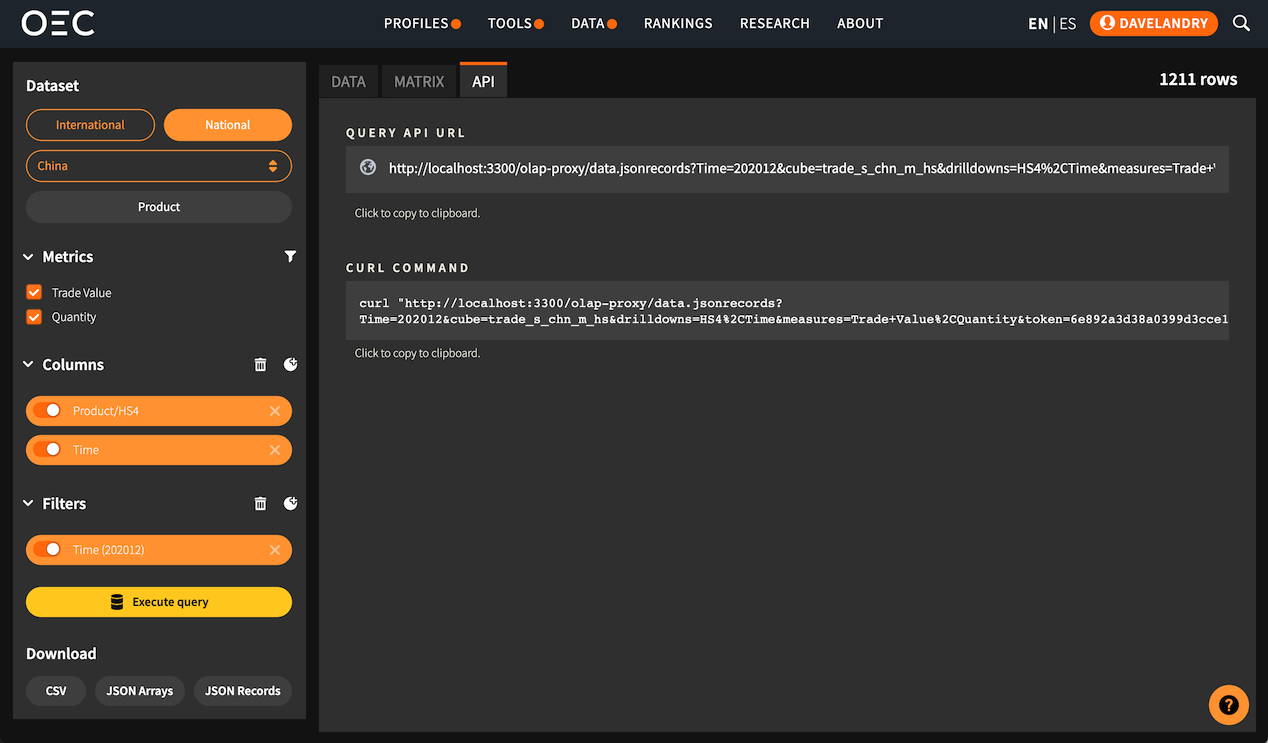
API Endpoint
Finally, once we are satisfied with our data selection, we can click on the 'API View' tab to find the specific API endpoint URL used to create the data we see in our 'Data Table' view.
Technical Definitions
Now that we've seen our first example of how to generate a data table based on a particular selection of data, let's take a closer look at some technical terms.
- •Datasets:Datasets are the fundamental data structure used by the OEC API. A dataset contains all data related to a particular topic from a particular source. For instance: you will see multiple datasets for international trade because we have a variety of different product classifications: SITC (Standard International Trade Classification), HS (Harmonized System) as well as different revisions like HS92 (1992 revision of the Harmonized System), HS96 (1996 revision of the Harmonized System) and so on.Data in each cube can be disaggregated by dimension. We can imagine a dimension as an edge of a cube, where the edge length depends on the dimension. As you may see a dimension is just a variable by which we can group by.In conclusion, cubes store a huge amount of data at the most disaggregate level. Storing data in this way allows for the ultimate level flexibility as columns can always be marginalized over and their values aggregated.
- •Drilldowns:Drilldowns are dataset dimensions. Thinking of datasets using a cube metaphor, the dimensions would be the edges. By default a dataset would be aggregated by all dimensions, choosing one from the drilldown menu allows us to disaggregate by that dimension.Taking the German regional dataset as an example, it has Time, Region and Product type as dimensions. Each dimension will appear as a drilldown at OEC API. So, the first step to create a request will be to specify at least one drilldown in order to retrieve data for that specific variable.Often times there will be a need to group data by different hierarchical levels. Say for instance we start our analysis by retrieving yearly trade data and want to move to a higher level of granulairy, say quarters or months. This is why dimensions also support different levels of hierarchy. Levels of hierarchy are a great way to group data while respecting the inherent hierarchy of the classification. We refer to levels of hierarchy in dimensions that have sub dimensions in their definition. For example, regions can be grouped by country and countries can be grouped by continent.When we create a query using the Data Explorer we have to decide which level of hierarchy we want to group the data and which levels to include.
- •Measures:Every cube contains different measures. This is why depending on the cube and dimensions selected for a query there will be different measures available. Measures are data values which can be aggregated. Measure can support different types of aggregations, such as sum, mean, min or max. Because of this, measures are usually integers, floats or percentages variables. In our case, examples of measures are trade value, weight, quantity, etc.
- •Cuts:Cuts allow us to filter the data based on a specific member of a chosen dimension. For example, if we were using the US subnational cube and wanted to see export data from the state of Colorado (instead of showing all states) we would cut on that particular member.

- •Advanced Options:
- •Debug MDX: This option enables the debug tool, which will indicate where the error is when a query is not working properly.
- •Apply distinct: This option acts as a filter, which will filter duplicated IDs, leaving only unique values.
- •Only return non-empty data: This option will skip results with missing values.
- •Include parents levels: This option will include the parent dimensions in the query, for drilldowns that have a parent dimensions to add.
- •Optimize sparse results: This option will skip rows where the measure is a null value.
Python Notebooks
Learn from the examples we prepared for you here: Python Notebooks