About the Site
The Observatory of Economic Complexity (OEC) is an online data visualization and distribution platform focused on the geography and dynamics of economic activities. The OEC integrates and distributes data from a variety of sources to empower analysts in the private sector, public sector, and academia.
The OEC is currently designed and developed by Datawheel, but it began as a research project at MIT's Collective Learning group (former Macro Connections Group). The OEC was the Master Thesis of Alex Simoes (2012), directed by Professor Cesar A. Hidalgo.
In 2012 the OEC was spun out of MIT as an open source project. The OEC was refined throughout the years, expanding its technical and analytical capacities.
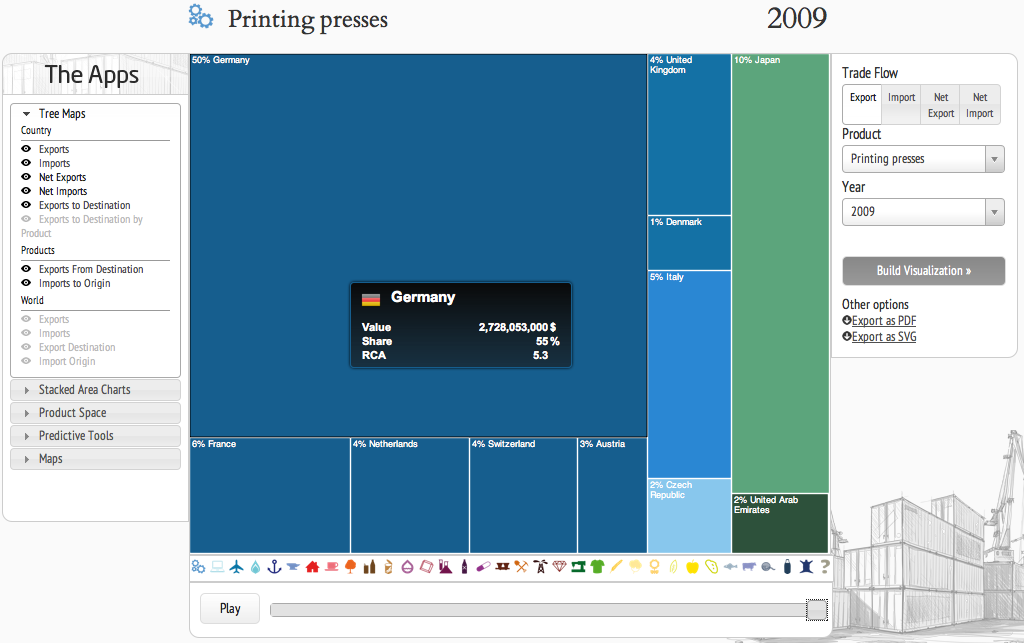
OEC 1.0 (2011-2013)
The first version of the OEC focused primarily on creating single visualizations of trade data. A primitive version of what you find today under the tool/visualizations menu. At that time, it was a pioneering effort in data visualization and distribution.
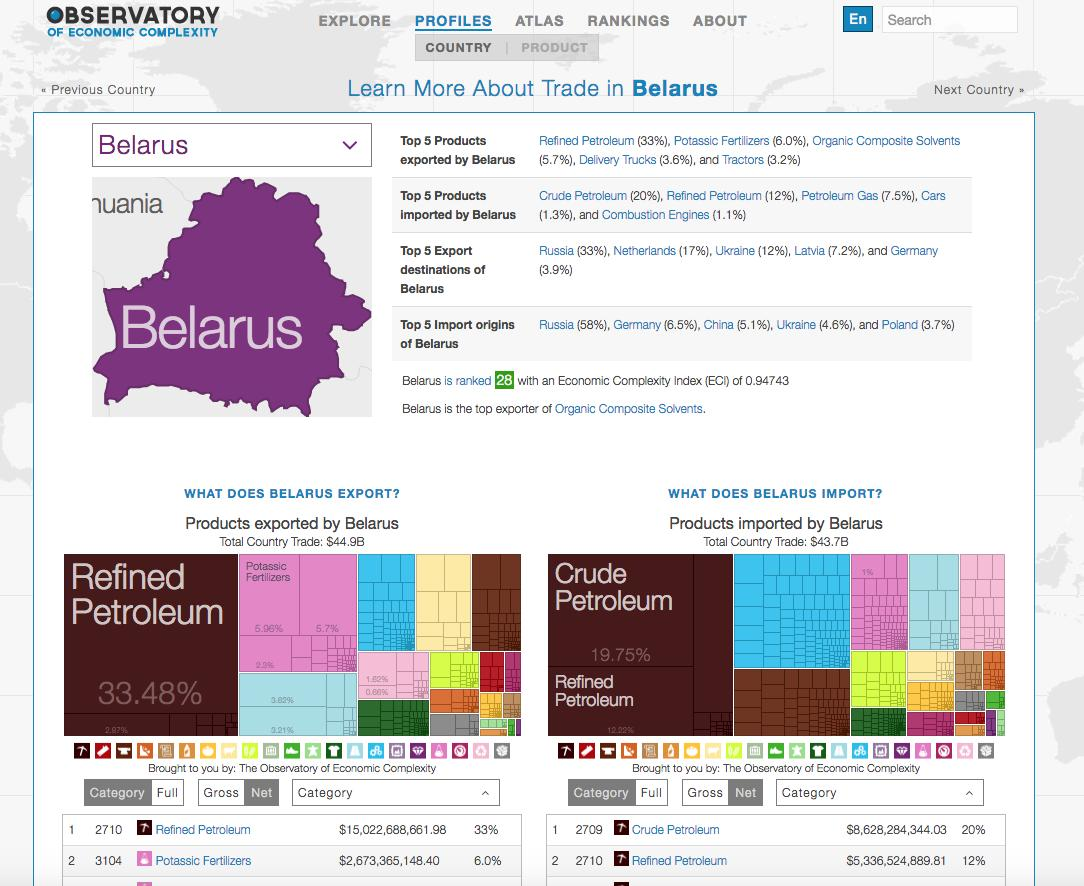
OEC 2.0 (2013-2015)
The second version of the OEC introduced the idea of profiles. These profiles were designed primarily for search engine optimization, but quickly grew into the most popular section of the site. The visualization builder (Explore in OEC 2.0) was still the main feature.
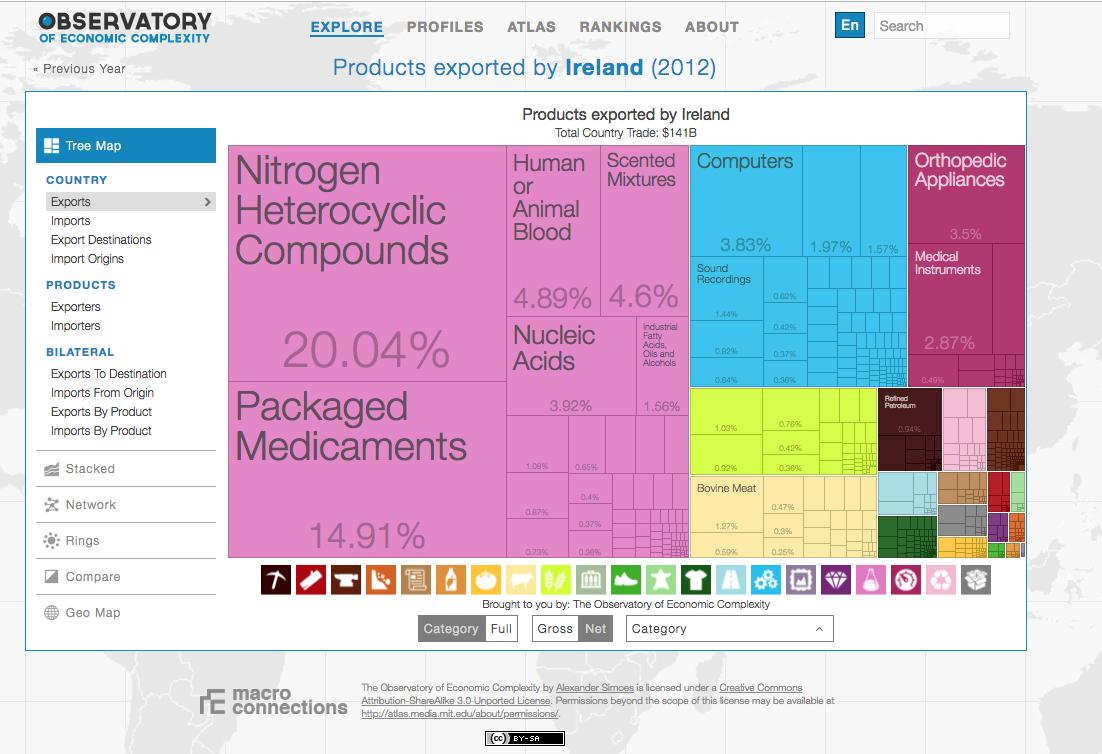
OEC 3.0 (2015-2020)
The 3.0 version of the OEC was designed around the idea of profiles. The visualization builder became a secondary feature, given the tool a more narrative flavor.
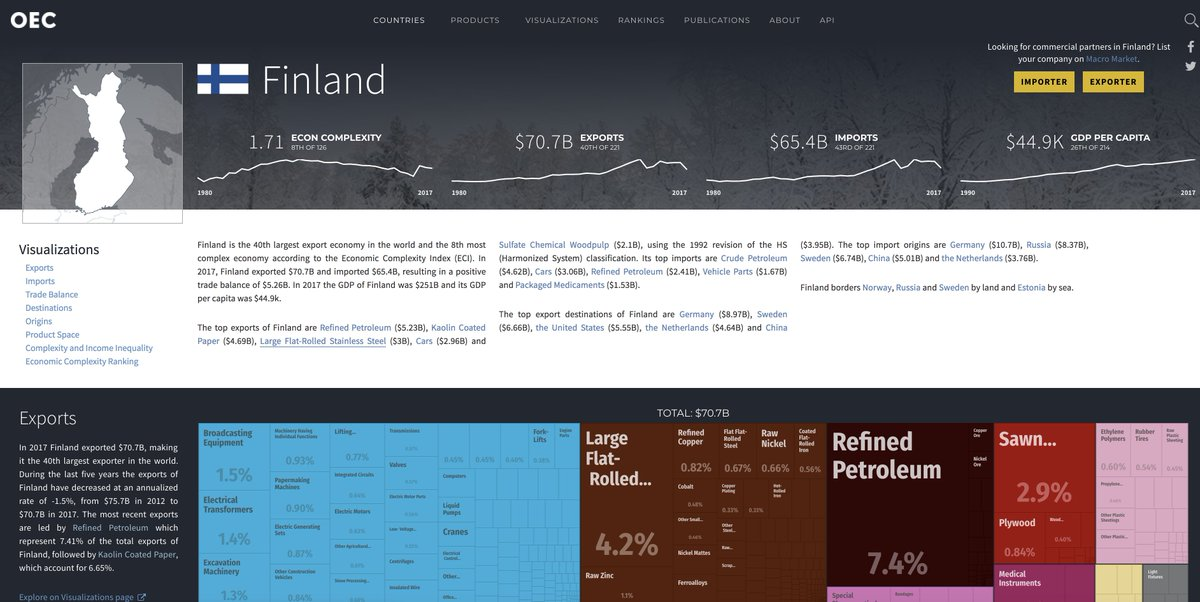
OEC 4.0 (2020-2021)
The 4.0 version of the OEC is the largest and most ambitious version of the OEC ever created. It includes subnational level data for dozens of countries, sourced directly from their public customs records. This makes the OEC much more recent, relevant, and higher resolution.
The 4.0 version of the OEC also includes several new features, such as a tunable forecast tool, the tariff explorer, and the ability to dynamically calculate economic complexity rankings.
OEC 4.0 was built from scratch on a completely new code base created solely by Datawheel.
OEC 5.0 (2021-Today)
The 5.0 version was launched in the summer of 2021, bringing subnational data from regions and provinces from over 30 major countries. This new version also gives users the ability to pay for both pro and premium subscription. The pro subscription includes access to a rich data explorer as well as the API for programmatic data access while the premium tier gives users the ability to download any of the 20+ subnational datasets newly added to the OEC.
Citation
If you would like to cite the OEC, you can cite the original 2011 computer science paper describing its creation:
AJG Simoes, CA Hidalgo. The Economic Complexity Observatory: An Analytical Tool for Understanding the Dynamics of Economic Development. Workshops at the Twenty-Fifth AAAI Conference on Artificial Intelligence. (2011)
Any visualizations of international trade data can be used with a Creative Commons - CC0 public domain license.