2020 Trends in Economic Complexity
Now that more than a fifth of the twenty-first century is behind us, it is time to take stock of long-term trends in economic complexity.
This month, at the OEC we released 2020 trade data. This includes, for the first time, 2020 estimates of the Economic Complexity Index (ECI) as well as updates for the previous years (since trade data is revised retroactively).
The 2020 Economic Complexity Index numbers are not too different from those of 2019, but they do continue to confirm some important long-term trends. These are:
1. The rise of East Asia
Back in the year 2000, the only East Asian economy in the top 20 of the ECI rankings was Japan. Today, 4 out of the top 6 economies are East Asian, including Japan (#1), Chinese Taipei (#3), South Korea (#5), and Singapore (#6). The rise of the latter three has been meteoric, with Chinese Taipei climbing from #22 to #2, Singapore from #21 to #6, and South Korea from #32 to #5 since the beginning of the century. Not too far behind we have China, which climbed from #54 in the year 2000 to #28 in 2020, putting it in a similar position in terms of economic complexity than that of Chinese Taipei, South Korea, and Singapore two decades ago.
This rise is partly explained by these economies losing specialization in low-end manufacturers (such as garments) and increasing specialization in material science-intensive industries, such as chemicals and electronics. For instance, back in the 1990s, Europe and North America amounted to about 40% of world trade in LCDs. However, by the middle of the last decade, China, South Korea, Japan, and Chinese Taipei, amounted to nearly 90% of all world trade in LCD panels.
2. The slide of the United States and Europe
The United States and Europe led the economic complexity rankings during the 20th century. But as in any ranking, for some countries to go up, others must go down. During the last 20 years, the US and some (but not all) European Economies began sliding down the ECI ranking.
In the last 20 years the US went down from #5 to #9, the UK from #6 to #13, France from #10 to #15, and Spain from #19 to #34. Other European economies, however, have been able to stay near the top. In particular, Switzerland overtook Germany as the #2 economy in terms of complexity.
3. The diverging fates of Natural Resource-Rich countries
Natural resource-rich economies have experienced diverging fates when it comes to economic complexity. On the one hand, Saudi Arabia and the United Arab Emirates have moved up the complexity rankings, rising respectively, from #46 to #32 and from #73 to #71 from 2000 to 2020. On the other hand, Brazil and Russia have continued to slide down. Brazil from #29 in the year 2000 to #47 in 2020, and Russia from #25 in the year 2000 to #43 in 2020.
Other natural resource-rich economies have fallen off a cliff. For example, Venezuela started the century at #53 and today is #105, experiencing the most substantial decline in economic complexity among all countries. But, again, this is a testament to how poor institutions can lead to the destruction of economic capacities.
4. Potential for future economic growth
Over the long run, countries tend to approach a level of income that is in equilibrium with the complexity of their economies. The 2020 ECI estimates tell us where we can expect future growth.
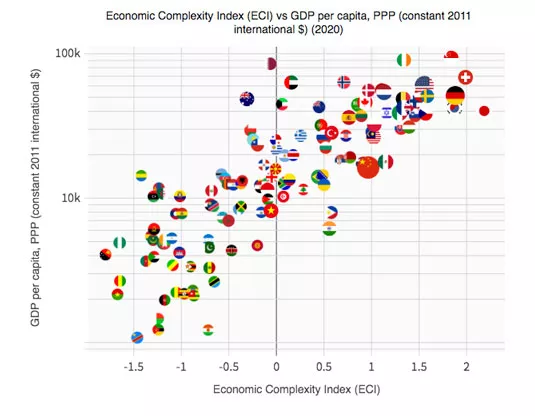
According to the latest data, India appears to be well-positioned for growth. Its economic complexity numbers (½ standard deviation above the world’s average) are comparable to that of countries that are much richer, such as Turkey, Russia, and Portugal. So we should expect India to be a key place for growth during the next 10 to 20 years. Other countries that continue to be in a good position when it comes to growth are the Philippines, China, Mexico, Kenya, Tanzania, and Senegal.
Learn More:
You can find economic complexity rankings for all countries on the OEC’s ECI rankings page.
About the Economic Complexity Index (ECI)
The Economic Complexity Index is a metric of the sophistication of an economy derived from the geographic distribution of economic activities. From a technical perspective, it is the use of dimensionality reduction techniques to learn the factors that best explain the geography of multiple economic activities. The ECI represents one of the earliest and most successful uses of machine learning to answer questions of economic development. Multiple studies have validated the ability of the ECI to explain future economic growth, as well as variations in income inequality and greenhouse gas emissions. Today, Economic Complexity methods are used in government offices throughout the world and have been cited in thousands of peer-reviewed publications. For a recent review of the field see: Hidalgo CA, Economic Complexity Theory and Applications, Nature Review Physics (2021).